Why and how
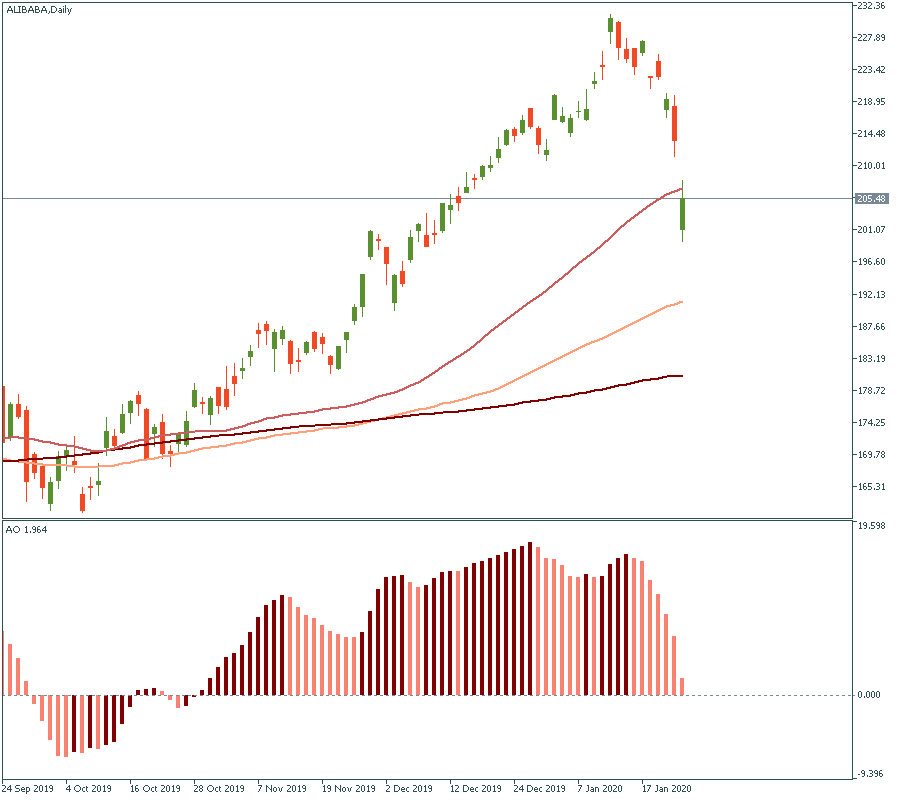
Looking at the chart below begs the most obvious question – why? An answer to this question defines the answer to the second most obvious question – how do I use it? Let’s try to figure the first one to see if it helps to reply to the second one.
Last autumn
Three months of exemplar rising is over for Alibaba stock price. Or is it? Strictly speaking, it is still too early to state: a week of falling doesn’t negate three months of almost line-like rising. But it does present a lot of things to question how bumpy the further road will be. We have several indications that things are going irregular, compared to the firm uptrend formed in October 2019: the price has never fallen this many consecutive days in a row, and has never done it so sharply. In fact, it never crossed the 50-day Moving Average since last autumn.
Like Rubicon for Caesar
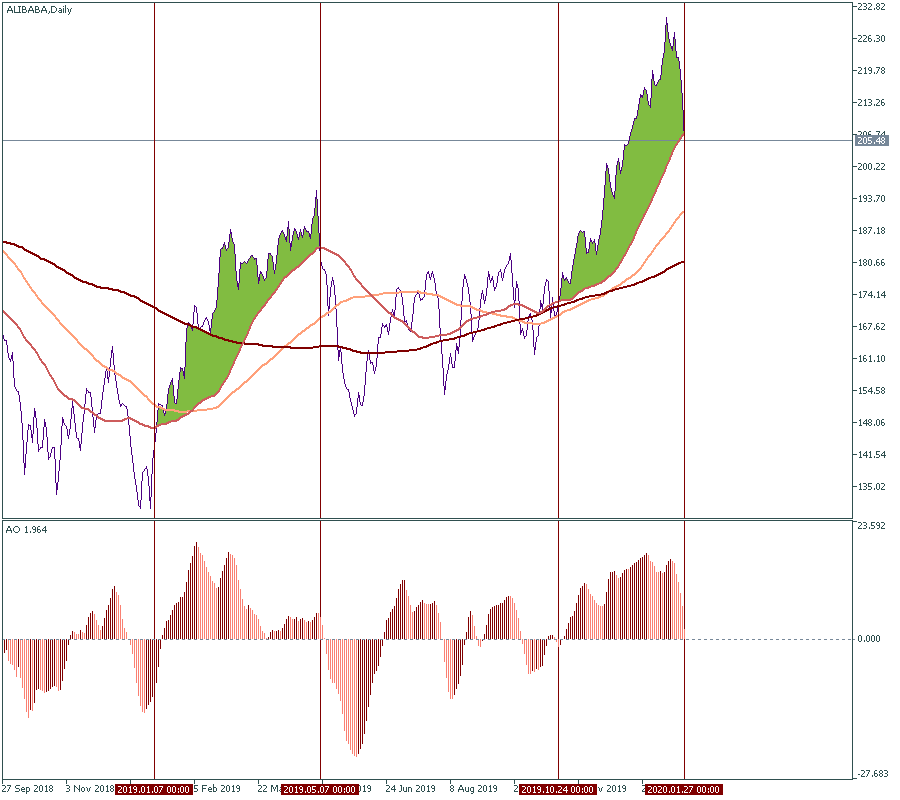
The following observation cannot be taken as a sure indicator of the following movement, but it makes sense to take it into account as a reflection of inner and outer processes affecting Alibaba. The below chart is the same daily timeframe that we have above but zoomed out. What we are looking for as the correlation between the price and the 50-day Moving Average, which is the closest among the three indicators to the actual price movement. And the pattern here is the following: sometimes, the stock price has periods of prolonged rise above the 50-day Moving Average, not even touching it. But when it ends – it ends. Once the price drops to the 50-MA and firmly crosses it, it doesn’t get back up. Instead, it falls into a period of turbulence moving along with all the Moving Averages, which get intercrossed between themselves and with the price. And such a period continues until the price gets high enough and stays above the 50-MA to enter another period of high-fly. Why we are interested to note that? Now is exactly where the price touches the 50-MA. If you switch to the candlestick chart, it will be already crossed. Make your conclusions.
Did I miss something?
Yes, we haven’t discussed the “why”. So here it is.
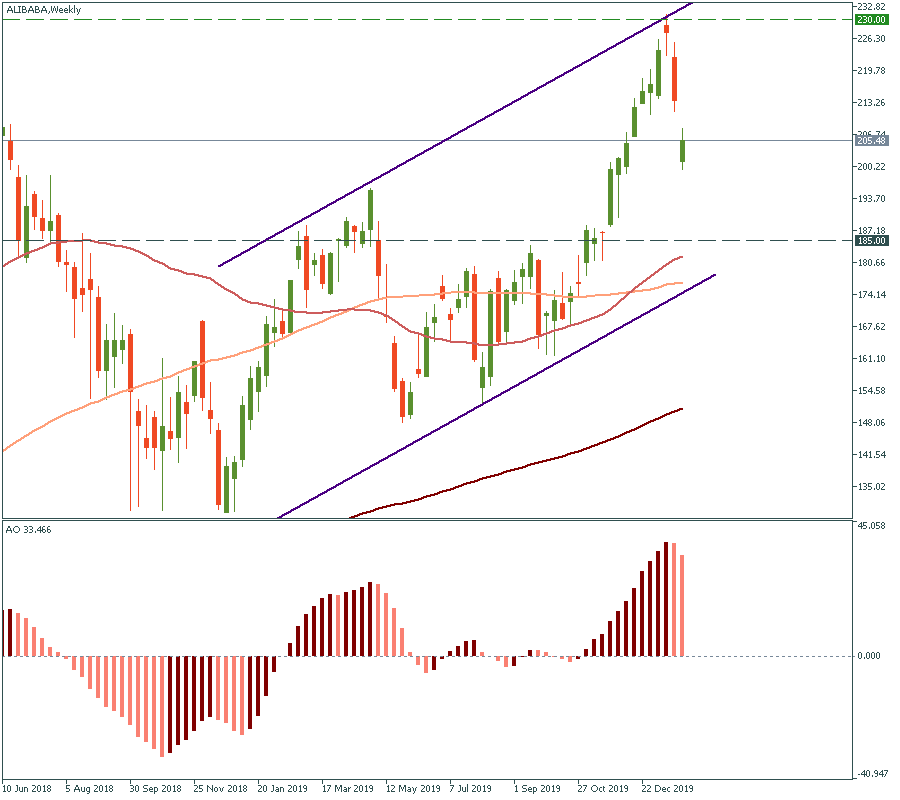
Primarily, there is the Coronavirus. It is something tragic as such, but for a trader, it may be a catalyst that makes some of the Chinese companies’ stocks cool down to the level where they would be attractive for buying. The weekly chart below shows how the recent drop may be presented as another wave down to the lower border of the uptrend. Hence, a mid-term strategy suggests selling now and buying at $185 per share later. Alternatively, the next step supposes buying at $185 per share and closing the position as soon as your greed doesn’t let you wait longer.
The race
However, there are some threats. Mainly, the competition. Alibaba is not alone, and its competitors, particularly Pinduoduo and JD.com, are breathing down its neck. Whenever the virus factor exhausts itself – and that will happen at some time unless the problem gets out of hands on a global scale – the sales and business victories of Alibaba will define its trend on the chart. Alibaba is struggling its way through: working the American consumer market, winning over customers in China, introducing cloud services and other activities. Now is a good moment to watch where it goes.
So where it goes?
Not “where”, but “when” – on February 13 Alibaba will announce its financial results of the 4th quarter of 2019. That will be a precious indicator: we will be able to measure the performance of the company not affected yet by the global external impact of the virus. Hence, we will know if the company stock price has reasons beyond biological to drop in the mid-term.
As usual
Buy stock. You know where to trade it. You just need to LOG IN